We Ran Our Own Audit Tool on Our React Site — and Fixed Everything It Found
 Melissa AshfordCOO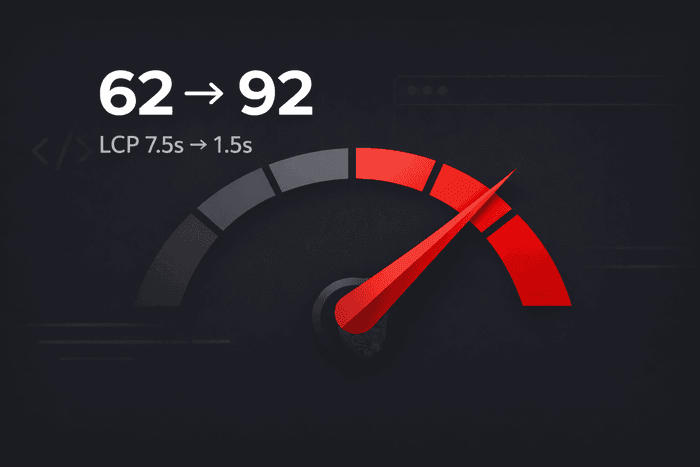
We build audit.lomray.com, a free web performance audit tool. It works on any stack; the site we pointed it at happens to be React. The real test of any diagnostic is whether you’ll point it at yourself, so in July our CEO ran our own homepage through it. It came back 62 out of 100, with a 7.5-second LCP and the causes spelled out.
That’s the tool doing its job: an honest baseline and a punch list. So we treated lomray.com like a client engagement — diagnose, fix, and measure between every step — and wrote down every number. Here is the full teardown, and how the same site finished at 92.
The server was never the problem
First instinct with a slow site is to blame the backend. Ours was innocent. TTFB came in at 0.1s, the page is server-rendered (10 KB of real text in the HTML response), and the full document arrived in 0.18s. Meanwhile LCP — the moment the hero image actually shows up — took 7.5 seconds.
A fast server paired with a 7.5s LCP means the entire delay lives in the client render path: everything the browser has to fetch and execute after the HTML lands. That narrowed the hunt to four suspects.
Suspect #1: WebP files that were larger than the PNGs they replaced
This one hurt. The homepage hero ships five responsive WebP variants with PNG fallbacks — textbook setup. Except the WebP files had been encoded losslessly, and lossless WebP on photographic screenshots is a trap. Every single variant was 2.2–2.6× bigger than its PNG fallback:
- xl.webp: 269,096 bytes vs xl.png: 109,828 bytes
- lg.webp: 244,434 bytes vs lg.png: 100,567 bytes
- md.webp: 205,050 bytes vs md.png: 82,575 bytes
So every real Chrome user — anyone whose browser advertises WebP support — was downloading the 269 KB hero. The "optimization" was a 2.4× pessimization, invisible unless you check actual byte sizes instead of trusting the file extension.
There is a second lesson buried here. Our first measurement missed it: a plain curl doesn't send an Accept: image/webp header, so it received the PNG fallback and we initially diagnosed "110 KB unoptimized PNG". Only reading the server code revealed the Accept-header switching — and that the real payload was 2.4× worse. Measure what the browser gets, not what your tooling gets.
The fix was re-encoding at quality 80. All five variants together dropped from 870,714 to 157,492 bytes (−82%), the LCP asset itself from 269 KB to 44.7 KB (−83%). We verified quality with PSNR over visible pixels — 31.6–33.2 dB, indistinguishable for decorative screenshots.
Suspect #2: the browser found the hero image late
No preload hint, no fetchpriority anywhere in the document. The browser had to parse the HTML, hit the picture element, resolve the right breakpoint, and only then start the download — while 10 CSS files fought for the same connection. One attribute (fetchpriority="high" on the hero image) tells the browser to start that download first instead of last.
Suspect #3: content-hashed assets with zero caching
Every file under /assets/ has a content hash in its filename — index-DZV4Rupd.js and friends. Hashed filenames exist so you can cache them forever: change the content and the name changes, so there is no stale-cache risk. Ours were served with cache-control: public, max-age=0. Immortal names, amnesiac headers. Every repeat visit re-validated every bundle.
The fix required a framework upgrade, because our SSR server (vite-ssr-boost 2.3.x) mounted its static handler before app hooks ran — there was no surface to set headers on. Version 2.8 exposes static-serving options directly; hashed assets now go out with max-age=31536000, immutable.
Suspects #4 and #5: the pass that actually moved the score
312 KB of render-blocking CSS across 10 files, and a single 537 KB JS entry bundle with no route splitting. We shipped the cheap fixes above first and measured honestly: 62 → 64, LCP down from 7.5s to about 6.4s. Real, but underwhelming — which told us the structural suspects were the ones holding the score hostage.
So the bundle got its own pass. Route-level code splitting came first: the homepage was paying the JavaScript bill for every other page on the site, and splitting by route cut what a first-time visitor actually downloads and executes. Then the animation library left the entry bundle — framer-motion was riding along on every page load, animations or not; it now loads lazily, only where something actually animates.
The last change was making below-the-fold sections stop rendering upfront. The contact form, the reviews block, the booking calendar — none of them are visible on first paint, but all of them were rendered (and their code executed) before the hero settled. Each now mounts only as it approaches the viewport, through one shared hook. One abstraction, applied three times — not three copies of the same trick. Our CEO reviewed the first version of this change and made us refactor the copy-paste out before merging. He was right.
The numbers, before and after
Every run below measured the live site through the same tool, audit.lomray.com, under the same conditions — no lab-vs-field mixing. All of them are from July 2026. A lab score is one run on one machine and one network, so read these as our deltas, not as a number you should expect to reproduce on us today.
We started at 62/100 with a 7.5-second LCP. The image, priority and caching pass moved it to 64/100, LCP around 6.4s. The bundle pass is what broke it open: 90/100 and 92/100 on two consecutive runs, LCP 1.4–1.5s.
From seven and a half seconds to a second and a half. Same server, same design, same content.
What this cost us in practice
A 7.5-second LCP on the site of a company that sells performance work is not a cosmetic issue. Slow hero paint is the first impression every prospect gets, and Google's field data feeds it straight into ranking. The full engagement — diagnosis, the image/caching pass, the bundle pass, measurement between every step — was a few days of work, and most of the leverage came from measuring before touching anything.
The tool that caught all of this is free. Run your own site through audit.lomray.com — it takes a URL and about thirty seconds, and it will tell you honestly if there is nothing wrong, which is sometimes the most useful answer.