How to Improve React App Performance: A 2026 Field Guide
 Melissa AshfordCOO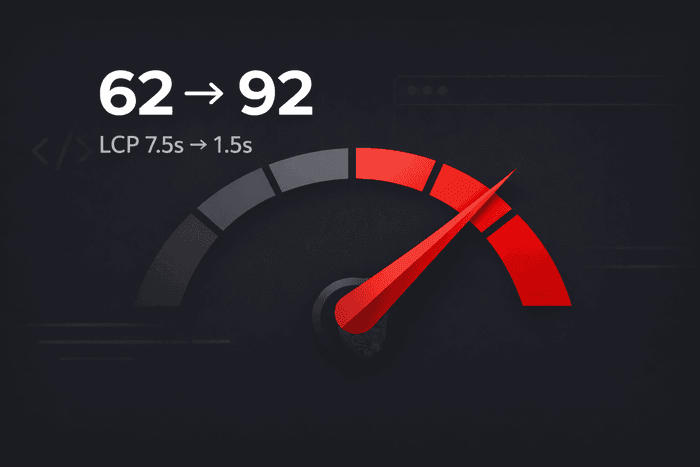
Most React apps don't get slow because of one big mistake. They get slow the way a garage fills up — a little at a time, until one day the page takes six seconds to become useful and nobody remembers which commit did it. Improving React app performance is less about a silver-bullet library and more about knowing where the time actually goes, then cutting it in the right order.
This is the order we use on real rescue work. It's the same sequence that took our own site from a Lighthouse score in the low 60s to the low 90s, and pulled Largest Contentful Paint from over six seconds down to about 1.4. No rewrite, no framework swap — just the fixes below, done in the order that pays off first. If you’re still working out why your app feels slow in the first place, start with the diagnosis — this guide picks up where that one leaves off.
Measure first, or you're guessing
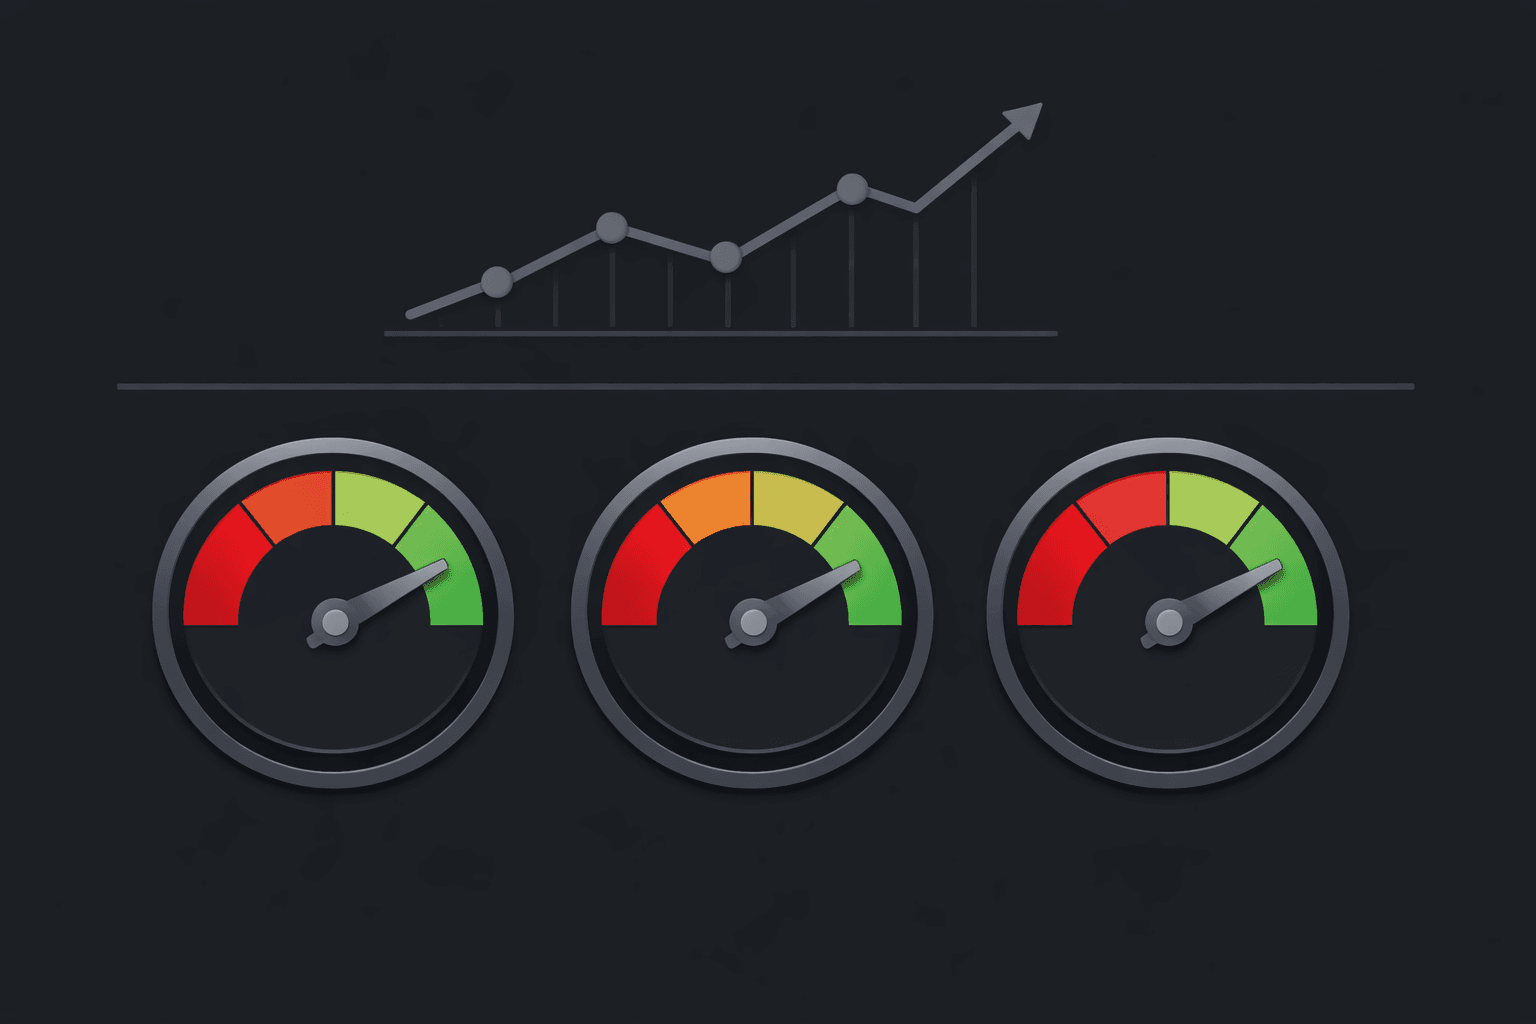
Before you touch a single component, get a number. Two numbers, really: what a lab tool says and what real users experience.
- Lab data comes from Lighthouse (in Chrome DevTools or CI). It's repeatable and great for catching regressions, but it runs on a simulated device, so it flatters or punishes you inconsistently.
- Field data — Core Web Vitals collected from actual visitors — is what Google ranks on. You'll find it in the Chrome User Experience Report and in Search Console's Core Web Vitals panel.
The three vitals worth memorizing: LCP (how fast the main content appears), INP (how fast the page responds to a tap or click), and CLS (how much the layout jumps around while loading). Chase these, not a vanity Lighthouse score. A CI Lighthouse run and prod field data almost never match — the field data is the one that decides your ranking, so treat the lab score as a smoke alarm, not the verdict.
Ship less JavaScript
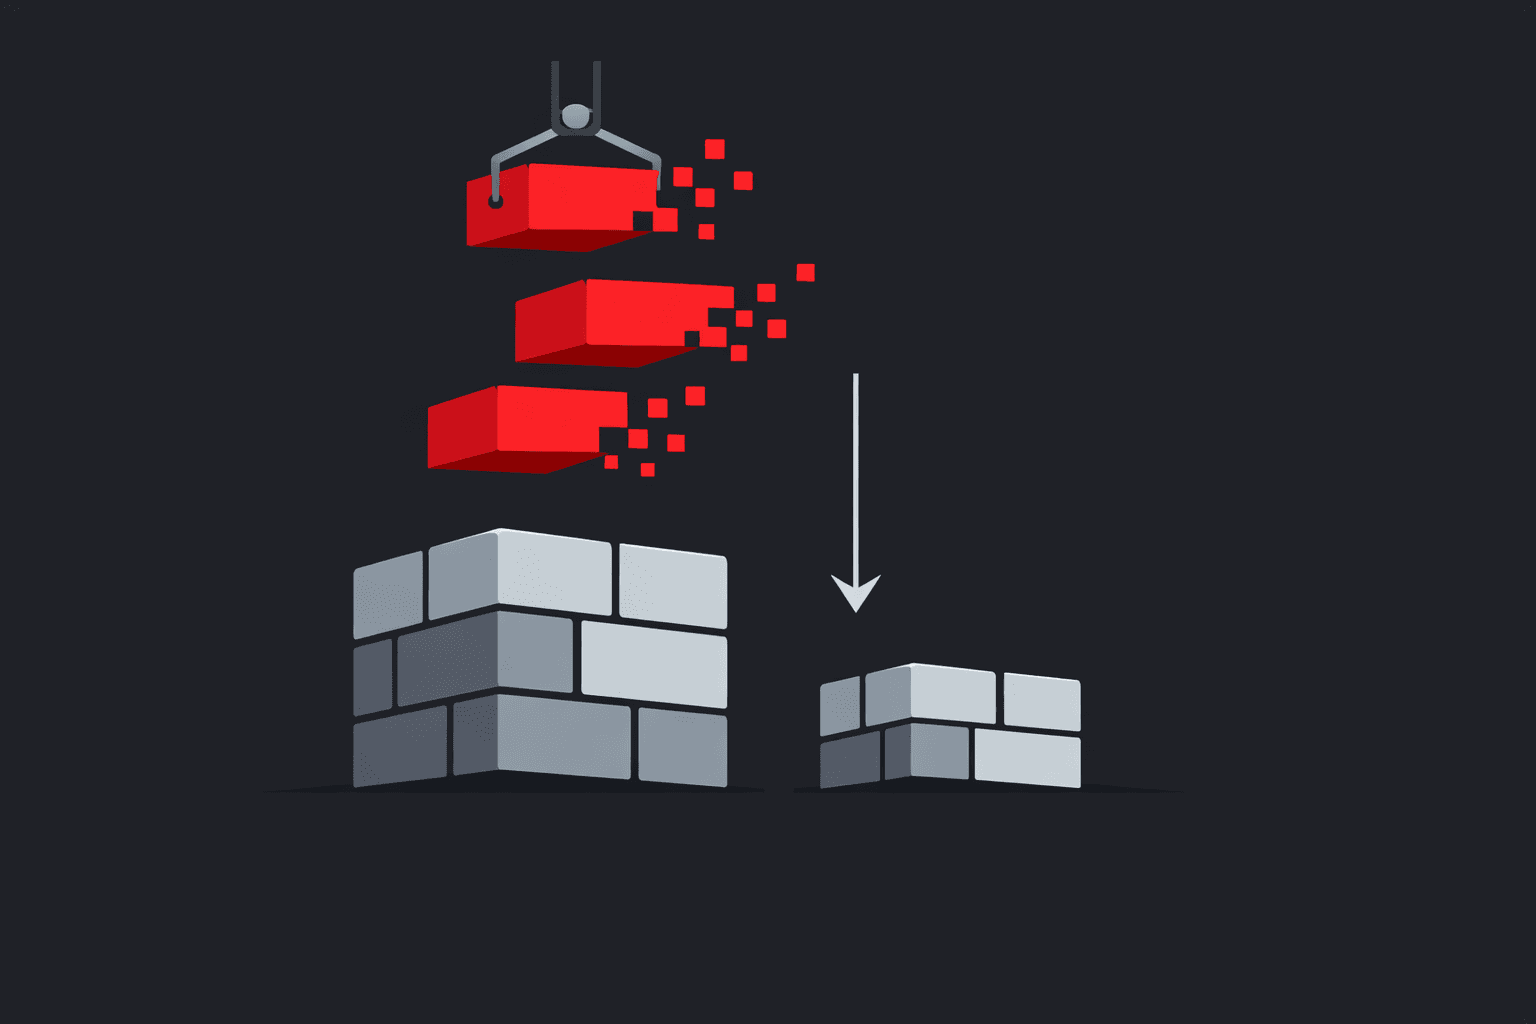
The single biggest lever in most React apps is the size of the bundle you send. Every kilobyte of JavaScript has to be downloaded, parsed, and executed on the main thread before your app becomes interactive — and on a mid-range phone that work is brutal.
Where to start:
- Split by route.
React.lazyplusSuspense(or your router's lazy loading) means a visitor landing on your pricing page doesn't download the code for the dashboard they may never open. - Run a bundle analyzer.
vite-bundle-visualizerorwebpack-bundle-analyzerwill show you, in one picture, the one dependency that's eating 300 KB for a feature two people use. Moment.js, giant icon sets, and duplicated lodash imports are the usual suspects. - Import narrowly.
import debounce from 'lodash/debounce'instead of pulling the whole library. Verify tree-shaking is actually removing what you think it is — plenty of packages defeat it. - Defer the non-critical. Analytics, chat widgets, cookie banners — none of it needs to block first paint. Load it after the app is interactive.
Impact: shipping less JavaScript improves nearly every metric at once — faster LCP, better INP, lower main-thread blocking. It's almost always the highest-return work on the list.
Fix the render path — carefully
This is where teams over-correct. Someone reads that re-renders are bad, wraps every component in memo, sprinkles useMemo and useCallback everywhere, and the app gets slower because now React is paying to memoize things that were cheap to recompute.
Do it with intent:
- Profile before you memoize. The React DevTools Profiler shows you which components actually re-render and how long they take. Memoize the expensive ones. Leave the rest alone.
- Virtualize long lists. Rendering a 5,000-row table into the DOM will kill any app.
@tanstack/react-virtualorreact-windowrender only what's on screen. - Keep keys stable. Using array index as a
keyon a reorderable list quietly forces React to rebuild nodes it could have reused. - Lift state down, not up. State that lives higher than it needs to re-renders half your tree on every change. Push it to the smallest component that owns it.
From our own work: when we rebuilt lomray.com's performance, the win didn't come from clever memoization — it came from measuring first, cutting bundle weight, and fixing the LCP path. Score went from the low 60s to 90+ and LCP dropped from over six seconds to about 1.4. On a recent client rescue the same playbook moved a product from 62 to the low 90s and cut LCP from 7.5 seconds to 1.4. The order of operations is the whole trick.
Get the main content on screen fast (LCP)
LCP is usually your hero image or headline block. If that element is slow, the page feels slow no matter what your JavaScript does.
- Optimize the LCP image. Modern format (WebP/AVIF), correctly sized for the viewport, and
fetchpriority="high"so the browser fetches it early. - Preload what matters, preconnect to origins. A
<link rel="preload">for the hero asset andpreconnectto your API or CDN shaves real milliseconds off the critical path. - Serve HTML that already has content. Server-side rendering or streaming (Next.js, Remix, or your own SSR) means the browser paints meaningful content before React hydrates, instead of staring at a blank div waiting for a bundle.
- Tame your fonts.
font-display: swapand a preloaded WOFF2 file stop invisible text and the flash that comes with it.
Kill layout shift and input lag (CLS + INP)
The last two vitals are about feel.
- CLS: reserve space. Set width and height on images and embeds, give ad and widget slots fixed dimensions, and never inject content above what the user is already reading. Most layout shift is one un-sized image away from fixed.
- INP: the newest Core Web Vital, and it punishes heavy main-thread work. Break long tasks up, move genuinely expensive computation into a web worker, and stop doing synchronous work inside event handlers. If a click takes 300 ms to register, users feel it even if your LCP is perfect.
Make performance a habit, not a heroic one-off
The reason performance decays is that nothing stops it from decaying. Bolt a ratchet onto the process:
- Set a performance budget — a max bundle size and a target for each vital — and let CI fail the build when a PR blows past it.
- Run Lighthouse in CI on every pull request so a regression is caught in review, not in production three weeks later.
- Monitor field data continuously. Real users on real devices tell you things your laptop never will.
Do this once and performance stops being a fire drill. Skip it and you'll be back here in six months.
Where to start this week
If you only do one thing: measure. Get your real Core Web Vitals in front of you, find the biggest number, and fix that. Ship less JavaScript, fix the LCP path, and re-measure. That single loop — measure, cut, re-measure — is what moves the score.
If you'd rather see your numbers in 30 seconds without setting anything up, run your site through our free React performance audit at audit.lomray.com — it pulls your live Core Web Vitals and flags what's dragging them down. And if you want the full before-and-after of how we did this on a real product, the React performance case study walks through every number.
Building or rescuing a React app and want a team that treats performance as a feature, not an afterthought? Talk to us — we do this for a living.